Visa (V) Stock Forecast – Predictions & Technical Analysis 21.10.2025
Visa stock forecast for October 2025
Current Market Position of Visa Stock
At present, Visa's stock price stands at $4.01 (365.12 rubles), outpacing average values from recent weeks. This performance comes against the backdrop of shifting economic indicators and changing consumer payment behaviors worldwide.
Today's trading session began at $3.99 (362.95 rubles), reaching a high of $4.02 (366.19 rubles) and a low of $3.96 (360.89 rubles). These movements confirm investors' readiness to establish new positions in the stock, suggesting growing confidence in Visa's market trajectory.
Key Price Points for Visa
The current price action demonstrates resilience above several key technical levels, positioning Visa favorably in the payments processing sector. With digital payment adoption accelerating globally, Visa's market positioning remains strategically advantageous.
In-Depth Technical Analysis of Visa Stock
Technical analysis provides crucial insights into Visa's market behavior and potential future movements. By examining various indicators, we can better understand the underlying momentum and trend directions.
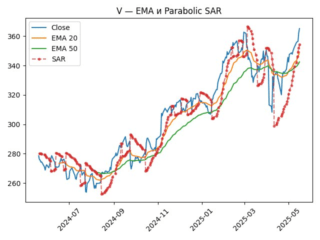
Moving Averages
Moving averages offer valuable perspective on Visa's price trajectory:
SMA 50: $3.73 (339.55 rubles)
SMA 200: $3.43 (312.46 rubles)
EMA 20: $3.83 (349.08 rubles)
EMA 50: $3.76 (342.45 rubles)
The current price positioning above all major moving averages suggests a bullish outlook, with particular strength demonstrated by remaining above the critical 200-day simple moving average (SMA).
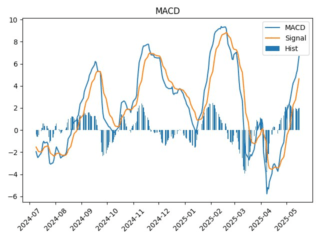
Technical Indicators and Oscillators
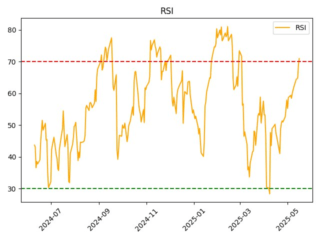
Key technical indicators reveal important aspects of Visa's current market dynamics:
Parabolic SAR: $3.89 (354.19 rubles) — effectively capturing the current trend
RSI: 70.94 — indicating neutral conditions with slight overbought tendencies
ATR: $0.08 (7.31 rubles) — reflecting market uncertainty
Additional technical measurements provide further insight:
CCI (20): 134.3 — pointing to strong upward momentum
ADX (14): 23.95 — indicating moderate trend strength
OBV: 221,127,100 — signaling persistent demand
The constellation of these indicators suggests a generally positive technical outlook, though the RSI approaching overbought territory warrants some caution.
Fundamental Analysis of Visa Inc.
Understanding Visa's fundamental metrics is essential for evaluating its long-term investment potential alongside technical indicators.
Key Financial Metrics
Visa demonstrates the following fundamental performance metrics:
EPS: $0.00 (0.0 rubles)
P/E Ratio: 36.62
ROE: 50.66%
ROA: 16.94%
Financial Health Indicators
The company's financial stability can be assessed through these metrics:
Debt/Equity Ratio: 54.59
Net Debt/EBITDA: $0.00 (0.0 rubles)
Free Cash Flow: $0.00 (0.0 billion rubles)
Market Capitalization: $7.68 billion (699.45 billion rubles)
Visa's impressive return on equity (ROE) of 50.66% demonstrates exceptional efficiency in generating profit from shareholders' equity, significantly outperforming industry averages.
Dividend Analysis for Income Investors
For income-focused investors, Visa's dividend profile offers important considerations.
Current Dividend Structure
Dividend Per Share: $0.0065 (0.59 rubles)
Dividend Yield: 0.17%
Ex-Dividend Date: May 12, 2025
Payment Date: June 2, 2025
While Visa's dividend yield remains relatively modest compared to traditional dividend stocks, the company's consistent payment history and growth potential make it worthy of consideration for dividend-growth portfolios.
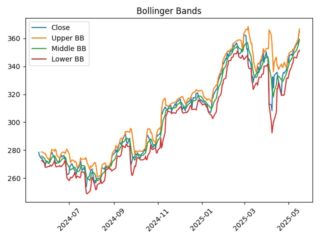
Price Range Analysis and Support/Resistance Levels
Understanding Visa's trading range helps identify potential entry and exit points.
52-Week Trading Range
52-Week Low: $2.78 (252.7 rubles)
52-Week High: $4.03 (366.54 rubles)
The current price sits near the upper boundary of this annual range, reflecting strong performance over the past year and approximately 44% appreciation from its 52-week low.
Candlestick Pattern Analysis
Current chart examination reveals:
📭 No definitive candlestick patterns detected.
This absence of clear reversal or continuation patterns suggests a period of price consolidation that may precede the next directional move.
Short-Term Price Forecasts for Visa Stock
Based on technical analysis and historical patterns, short-term price projections can be estimated.
Next-Day Price Projection
The projected price for Visa's next trading session: $3.90 (355.42 rubles)
This forecast suggests a slight retracement from current levels, potentially offering a more favorable entry point for those looking to establish new positions.
Investment Risk Assessment
Every investment carries inherent risks that must be carefully evaluated.
Risk Classification
❤️ High Risk — The current assessment indicates potential overvaluation, weak trend momentum, or inconsistent returns.
This classification stems primarily from the relatively high P/E ratio and RSI approaching overbought territory, suggesting investors should exercise appropriate caution.
Strategic Support and Resistance Levels
Identifying key price levels helps manage entry and exit strategies effectively.
Critical Price Zones
The analysis highlights important support and reversal zones at:
$3.73 (339.55 rubles) — Corresponding to the 50-day SMA
$3.76 (342.45 rubles) — Aligned with the 50-day EMA
These levels represent significant technical support that could serve as potential entry points during any market pullbacks.
Long-Term Investment Outlook for Visa
For investors with extended time horizons, Visa's positioning in the global payments ecosystem remains compelling.
Growth Catalysts and Market Opportunities
Several factors support Visa's continued expansion:
Digital Payment Acceleration: The ongoing shift from cash to digital payments globally
Cross-Border Recovery: Resumption of international travel and transactions
Fintech Partnerships: Strategic collaborations enhancing market reach
Emerging Market Penetration: Expansion into underbanked regions
These growth drivers position Visa favorably for continued market share expansion in the evolving payments landscape.
Technical Trend Strength and Volatility Analysis
Understanding trend momentum and price variability provides crucial context for trading decisions.
Trend and Volatility Metrics
Current Volatility (ATR): $0.08 (7.31 rubles)
Trend Strength (ADX): 23.95
These figures indicate moderate trend strength with manageable volatility, creating potentially favorable conditions for position building.
Comparative Industry Analysis
Positioning Visa within its competitive landscape offers additional perspective on its relative investment appeal.
Competitive Positioning
Visa maintains several advantages within the payment processing sector:
Network Effect: Unparalleled global merchant acceptance
Brand Recognition: Trusted worldwide payment solution
Innovation Pipeline: Continued investment in payment technologies
Regulatory Navigation: Established compliance infrastructure
These competitive advantages contribute to Visa's durable market position despite increasing competition from traditional and fintech challengers.
Summary: Visa Investment Outlook
The comprehensive analysis indicates Visa maintains a stable outlook with positive long-term potential. Current technical indicators suggest upward momentum, though short-term caution is warranted due to potential overvaluation signals.
Strategic Considerations
For investors considering Visa stock:
Long-Term Investment: The market appears attractive for long-term positions given the current volatility of $0.08 (7.31 rubles) and trend strength of 23.95.
Entry Strategy: Consider establishing partial positions at current levels with plans to add during potential pullbacks to identified support zones.
Risk Management: Implement appropriate position sizing given the high-risk classification and proximity to 52-week highs.
Visa's fundamental business model, entrenched network advantages, and global digital payment tailwinds continue to support its long-term investment thesis despite short-term technical concerns.
Conclusion: Balancing Opportunity and Risk
Visa remains a cornerstone holding for many portfolios focused on the digital economy and financial technology sectors. The current analysis reveals a stock demonstrating continued strength while approaching potential resistance levels.
Careful attention to the identified support zones at $3.73 (339.55 rubles) and $3.76 (342.45 rubles) will be critical for investors looking to optimize entry points. While short-term volatility remains possible, Visa's fundamental business positioning and technical trend support suggest continued resilience.
Predicted price
Historical return calculator
Income for the selected period
Total: +$141.24+0.94%
Calculation based on the dynamics of the share price for the period from 21.09.2025 to 21.10.2025
read other forecasts
No comments yet
Be the first to share your thoughts on this